Debugging Playwright Failures in GitHub Actions
Debugging Playwright failures in GitHub Actions requires traces, artifacts, and CI-aware debugging workflows. Learn how to diagnose failures quickly.
Playwright failures in GitHub Actions are one of the most frustrating issues engineers encounter when running browser tests in CI.
A test passes locally on a developer machine. The pull request looks good. Everything appears stable.
Then GitHub Actions runs the pipeline and one test fails.
You rerun the workflow and it passes.
Later another pipeline fails with the same test.
This pattern makes it feel like CI is unreliable, but that assumption is usually wrong. **Playwright failures in GitHub Actions almost always reveal hidden assumptions in your test suite.**
GitHub Actions runs tests in a different environment than your laptop. The runners are ephemeral, resources are limited, and tests often execute in parallel across workers. Small differences in timing, configuration, or state quickly expose fragile tests.
A typical failure might look like this:
Timeout 30000ms exceeded while waiting for locator('[data-testid="submit"]')The error message tells you what happened but not why it happened.
Did the page fail to load?
Did authentication break earlier?
Did the UI render slowly under CI conditions?
Did another test modify shared data?
Without artifacts such as traces, screenshots, and logs, debugging becomes guesswork. Increasing timeouts might make the failure disappear temporarily, but it rarely solves the real problem.
The correct approach is to treat CI failures as signals about how your tests behave under realistic conditions.
---
Why Playwright Failures in GitHub Actions Happen
CI runners are slower and less predictable
GitHub-hosted runners are not designed to mimic a developer workstation. They run inside shared infrastructure with limited CPU and memory.
This changes the performance profile of your application and your tests.
You may observe:
- slower JavaScript execution
- delayed UI rendering
- longer API responses
- inconsistent CPU scheduling
Tests that rely on implicit timing assumptions often fail under these conditions.
For example:
await page.click('text=Save');
await expect(page.getByText('Saved')).toBeVisible();
If the application displays the confirmation only after a backend request completes, slower CI environments may reveal a race condition.
Locally the UI appears instantly. In CI it appears a few hundred milliseconds later, which causes the assertion to fail.
Parallel execution exposes hidden dependencies
Playwright encourages parallel test execution, and GitHub Actions pipelines often run multiple workers simultaneously.
Parallelism improves pipeline speed but introduces risks.
Common problems include:
- multiple tests modifying the same account
- shared database records
- race conditions in setup scripts
- conflicting file writes
These issues often remain invisible when tests run sequentially during local development.
Parallel execution doesn't create the bug. It simply exposes it.
Configuration differences between CI and local machines
Another frequent source of failures is environment drift.
Your local environment may differ from GitHub Actions in several ways:
- Node.js version
- browser version
- environment variables
- operating system packages
- timezone or locale
Even small configuration differences can break browser automation tests.
For example, date formatting or feature flags might behave differently in CI if the environment configuration is incomplete.
Headless browser debugging limitations
Most CI pipelines run browsers in headless mode.
Headless mode is reliable, but debugging without artifacts becomes difficult.
If traces, screenshots, and videos are not collected, engineers only see the final error message. That makes it much harder to determine whether the failure was caused by:
- a UI issue
- a backend error
- an incorrect selector
- missing authentication
Capturing artifacts transforms CI failures from vague errors into actionable debugging data.
---
Recognizable Symptoms of Playwright Failures in GitHub Actions
Repeated timeout failures
The most common symptom of CI instability is timeout errors.
Example:
Timeout 30000ms exceeded while waiting for locatorTimeout-heavy tests usually indicate synchronization problems rather than slow infrastructure.
Typical root causes include:
- waiting for elements before the application is ready
- relying on DOM presence instead of application state
- missing network synchronization
- animations delaying UI updates
Timeouts are rarely solved by increasing wait times. They are solved by waiting for the correct signals.
Authentication failures
CI environments frequently expose authentication assumptions.
Typical issues include:
- missing secrets in GitHub Actions
- expired login storage state
- incorrect environment URLs
- test accounts blocked by rate limits
When multiple tests fail during the first step, authentication setup should be investigated immediately.
Flaky reruns
A test that passes after rerunning the pipeline is not healthy.
Flaky reruns typically indicate:
- race conditions
- asynchronous UI updates
- inconsistent backend responses
- shared test data
Retries may keep pipelines green, but they should never replace real fixes.
Early test failures
If failures occur immediately after the test begins, the issue may be related to environment setup rather than Playwright itself.
Common examples include:
- the application server not fully started
- incorrect base URL
- database migrations failing
- environment variables missing
Debugging test code before verifying environment setup often wastes time.
---
How to Debug Playwright Failures in GitHub Actions
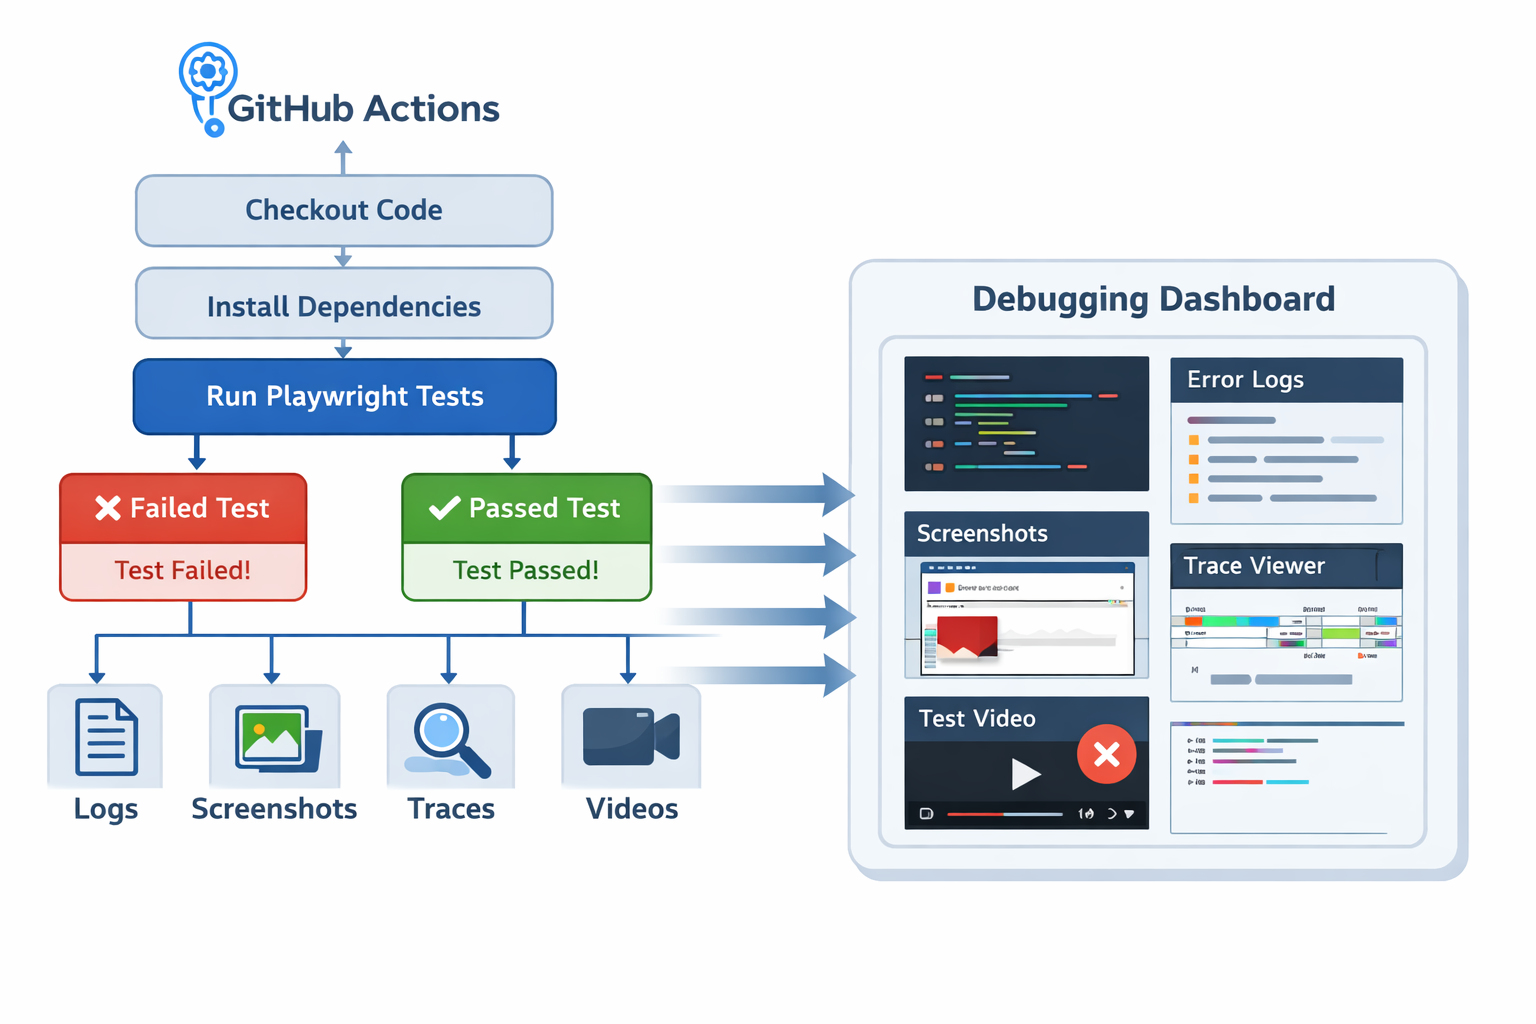
Capture artifacts for every CI run
Debugging CI issues without artifacts is extremely difficult.
Playwright supports automatic artifact generation when tests fail.
A typical configuration looks like this:
import { defineConfig } from '@playwright/test';

export default defineConfig({
  use: {
    trace: 'retain-on-failure',
    screenshot: 'only-on-failure',
    video: 'retain-on-failure'
  },
  reporter: [
    ['html'],
    ['list']
  ]
});
Artifacts must also be uploaded by the GitHub Actions workflow.
- name: Run Playwright tests
  run: npx playwright test

- name: Upload Playwright artifacts
  if: always()
  uses: actions/upload-artifact@v4
  with:
    name: playwright-artifacts
    path: |
      playwright-report/
      test-results/
The `if: always()` condition ensures artifacts are preserved even when the job fails.
Inspect Playwright traces first
When debugging CI failures, the Playwright trace viewer should be the first tool you open.
Traces provide a step-by-step replay of the test execution.
They include:
- DOM snapshots
- screenshots
- network activity
- console messages
- test actions and timings
This context often reveals the failure cause within minutes.
For deeper trace analysis, see the internal guide:
/blog/playwright-trace-viewer
Tools such as SentinelQA aggregate traces, logs, screenshots, and videos from CI pipelines so engineers can inspect failures without downloading artifacts individually.
This makes debugging complex CI failures significantly faster.
Verify CI environment configuration
Before modifying test code, verify that the GitHub Actions environment matches your expectations.
Printing environment information inside the workflow can help:
- name: Print environment info
  run: |
    node -v
    npm -v
    npx playwright --version
    echo "CI=$CI"
    echo "BASE_URL=$BASE_URL"
    uname -a
This confirms:
- Node.js version
- Playwright version
- environment variables
- operating system details
Configuration mismatches are a common root cause of CI-only failures.
Reproduce CI conditions locally
Sometimes the fastest debugging approach is simulating CI conditions locally.
Useful commands include:
Run tests headless:
npx playwright test --headed=falseDisable parallelism:
npx playwright test --workers=1Run a specific failing test:
npx playwright test tests/checkout.spec.tsReducing the scope of execution helps isolate the problem more quickly.
For a broader CI debugging workflow, see:
/blog/debug-playwright-ci
---
Common Mistakes
Adding arbitrary delays
One of the most common mistakes when dealing with Playwright failures in GitHub Actions is adding static delays.
Example:
await page.click('text=Submit');
await page.waitForTimeout(5000);
await expect(page.getByText('Success')).toBeVisible();
This hides the real issue rather than fixing it.
A better solution waits for an application event.
await Promise.all([
  page.waitForResponse(r => r.url().includes('/submit') && r.ok()),
  page.click('text=Submit')
]);
Waiting for meaningful signals makes tests deterministic.
Using fragile selectors
Selectors tied to CSS structure are brittle.
Example:
page.locator('.container > div:nth-child(3) button')Stable selectors should rely on accessibility roles or test IDs.
page.getByRole('button', { name: 'Submit' })
page.getByTestId('submit-button')
Stable selectors reduce CI failures caused by small UI changes.
Ignoring test isolation
Shared test state creates unpredictable behavior.
Examples include:
- multiple tests modifying the same user account
- shared database records
- reused browser storage state
Each test should ideally create its own data and clean up afterward.
---
Better Debugging Workflow for Playwright Failures in GitHub Actions
Start investigations from artifacts
Effective debugging begins with evidence.
Recommended workflow:
1. Open the Playwright trace. 2. Inspect network requests. 3. review console errors. 4. examine screenshots. 5. confirm CI configuration. 6. reproduce locally with minimal scope.
This structured process avoids guesswork.
Separate flaky tests from product regressions
CI failures typically fall into two categories.
Deterministic failures indicate real application bugs.
Flaky failures indicate instability within the test suite.
Tracking flaky tests separately helps maintain reliable pipelines.
For more guidance on diagnosing instability, see:
/blog/flaky-playwright-tests
Treat observability as a first-class CI feature
Mature test pipelines treat debugging artifacts as standard outputs.
Every CI run should capture:
- logs
- traces
- screenshots
- videos
Observability significantly reduces the time required to diagnose failures.
---
Practical Tips
Align local and CI environments
Pin versions of Node.js, Playwright, and browsers to avoid configuration drift.
Consistent environments reduce unexpected CI failures.
Validate environment variables early
Tests should fail immediately when required configuration is missing.
Example:
if (!process.env.BASE_URL) {
  throw new Error('BASE_URL environment variable is missing');
}
Early validation prevents confusing downstream errors.
Reduce parallelism during debugging
When investigating failures, run tests with a single worker.
Parallel execution can obscure the root cause.
Log browser console messages
Frontend errors often explain UI failures.
Logging console messages can reveal hidden issues.
page.on('console', msg => {
  console.log(msg.text());
});
Treat retries as diagnostic signals
Retries are useful for keeping pipelines moving, but they should not hide instability.
A test that passes after retrying still contains a problem that should be investigated.
---
Conclusion
Playwright failures in GitHub Actions are rarely random. They reveal weaknesses in test design, environment configuration, or application synchronization.
CI environments are stricter than local machines. They expose issues that were always present but harder to detect.
The fastest path to resolving CI failures involves three key practices:
- consistent artifact collection
- trace-first debugging
- synchronization with real application signals
When tests rely on meaningful events rather than arbitrary delays, they behave reliably across environments.
Instead of viewing GitHub Actions as unpredictable, teams should treat it as a powerful debugging environment that surfaces hidden problems early in the development cycle.